Inflation: Influential, Impactful or Indifferent?
While high consumer price inflation is driving employee
expectations towards higher salary increases, boards are keener than ever to see a correlation of salary increases with
business performance.
budgets upwards to adjust for the higher cost of living. However, since salary increase decisions are made
at the beginning of the year (January to March) and GDP and inflation estimates are for the year ending, there is a lag
in the decision-making. Hence, the previous year’s GDP and CPI estimates through the year are more likely to impact
the salary increase decisions than the year-end estimates. So with this, we conducted statistical regressions to predict
salary increases for future years, using previous year’s inflation rates (CPI) as an independent variable (refer to
data in Exhibit 4). The outcome was an R2 (coefficient of correlation) of 0.93, suggesting that 93% of the salary
increases can be attributed to changes in inflation during years 2009-13. The above data therefore comfortably suggested
that this equation lends itself as a fairly reliable model to predict salary increases at a broad level in any given year
using CPI estimates available.Please note: While regression is a good tool to derive predictive analysis, caution has to
be exercised especially when the coefficient of correlation is below 0.4and data points available are only for five
years as opposed to a required set of 20-30 for building a strong regression model. R2is a direct measure of how much of
the total variation in salary increases can be attributed to, or ‘explained by’ the relationship with another
variable.
Hypothesis 3 – Inflation affects employees Differently Depending on Where they are in the
organizational Hierarchy and Life stage
The question most often debated is whether the impact of inflation is really a valid consideration for
employees across all levels in an organization or is the impact of inflation felt differently across different
management levels.To prove this hypothesis, we analyzed consumption expenditure across varying fixed income levels
(mapped to 10 Aon Hewitt management levels) and assumed life stages of employees. This analysis of spendable income was
conducted across 13 categories of goods and services which include food, beverage, tobacco, fuel & light, housing,
clothing & footwear, education, medical care, transport & communication. These categories are comparable to the
overall composition of the consumer price index in India.Subsequently, we determined the impact of inflation (CPI) on
total fixed income by applying the inflation rate (assumed at 8% for the purpose of this analysis) on the spendable
income by level. This helped us determine the extent to which inflation erodes the spendable income in India and the
degree of erosion across levels. Analysis for the same is presented in Exhibit 5 (page 24).
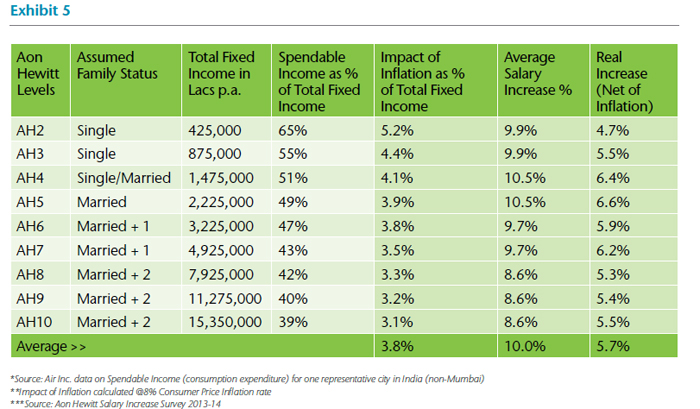
Exhibit 5 above presents a summary of our analysis of spendable income across levels and impact of inflation
on the same and on total fixed income. AH2 represents the lowest level within an organization (entry level
for graduates) and AH10 represents the highest level within an organization (excluding the CEO. This level
comprises multi/large function or business head roles).
|