More Like This
-
Capability Overview
Mergers and Acquisitions (M&A)

Whichever way you cut it, global M&A in 2023 was lacklustre as deal value fell by around 17% year-over-year and deal volumes struggled to move the needle, despite the fourth quarter of 2023 registering relative improvement compared to the same period in 2022.
From the cauldron of necessity, however, a discernible correlation emerges between the drop-off in M&A and more positive developments in the M&A insurance market, as insurers strive to differentiate not only on pricing and coverage but also in more indirect ways: adding sector specialists to enhance underwriting and coverage and continuing to emphasize - understandably - claims record.
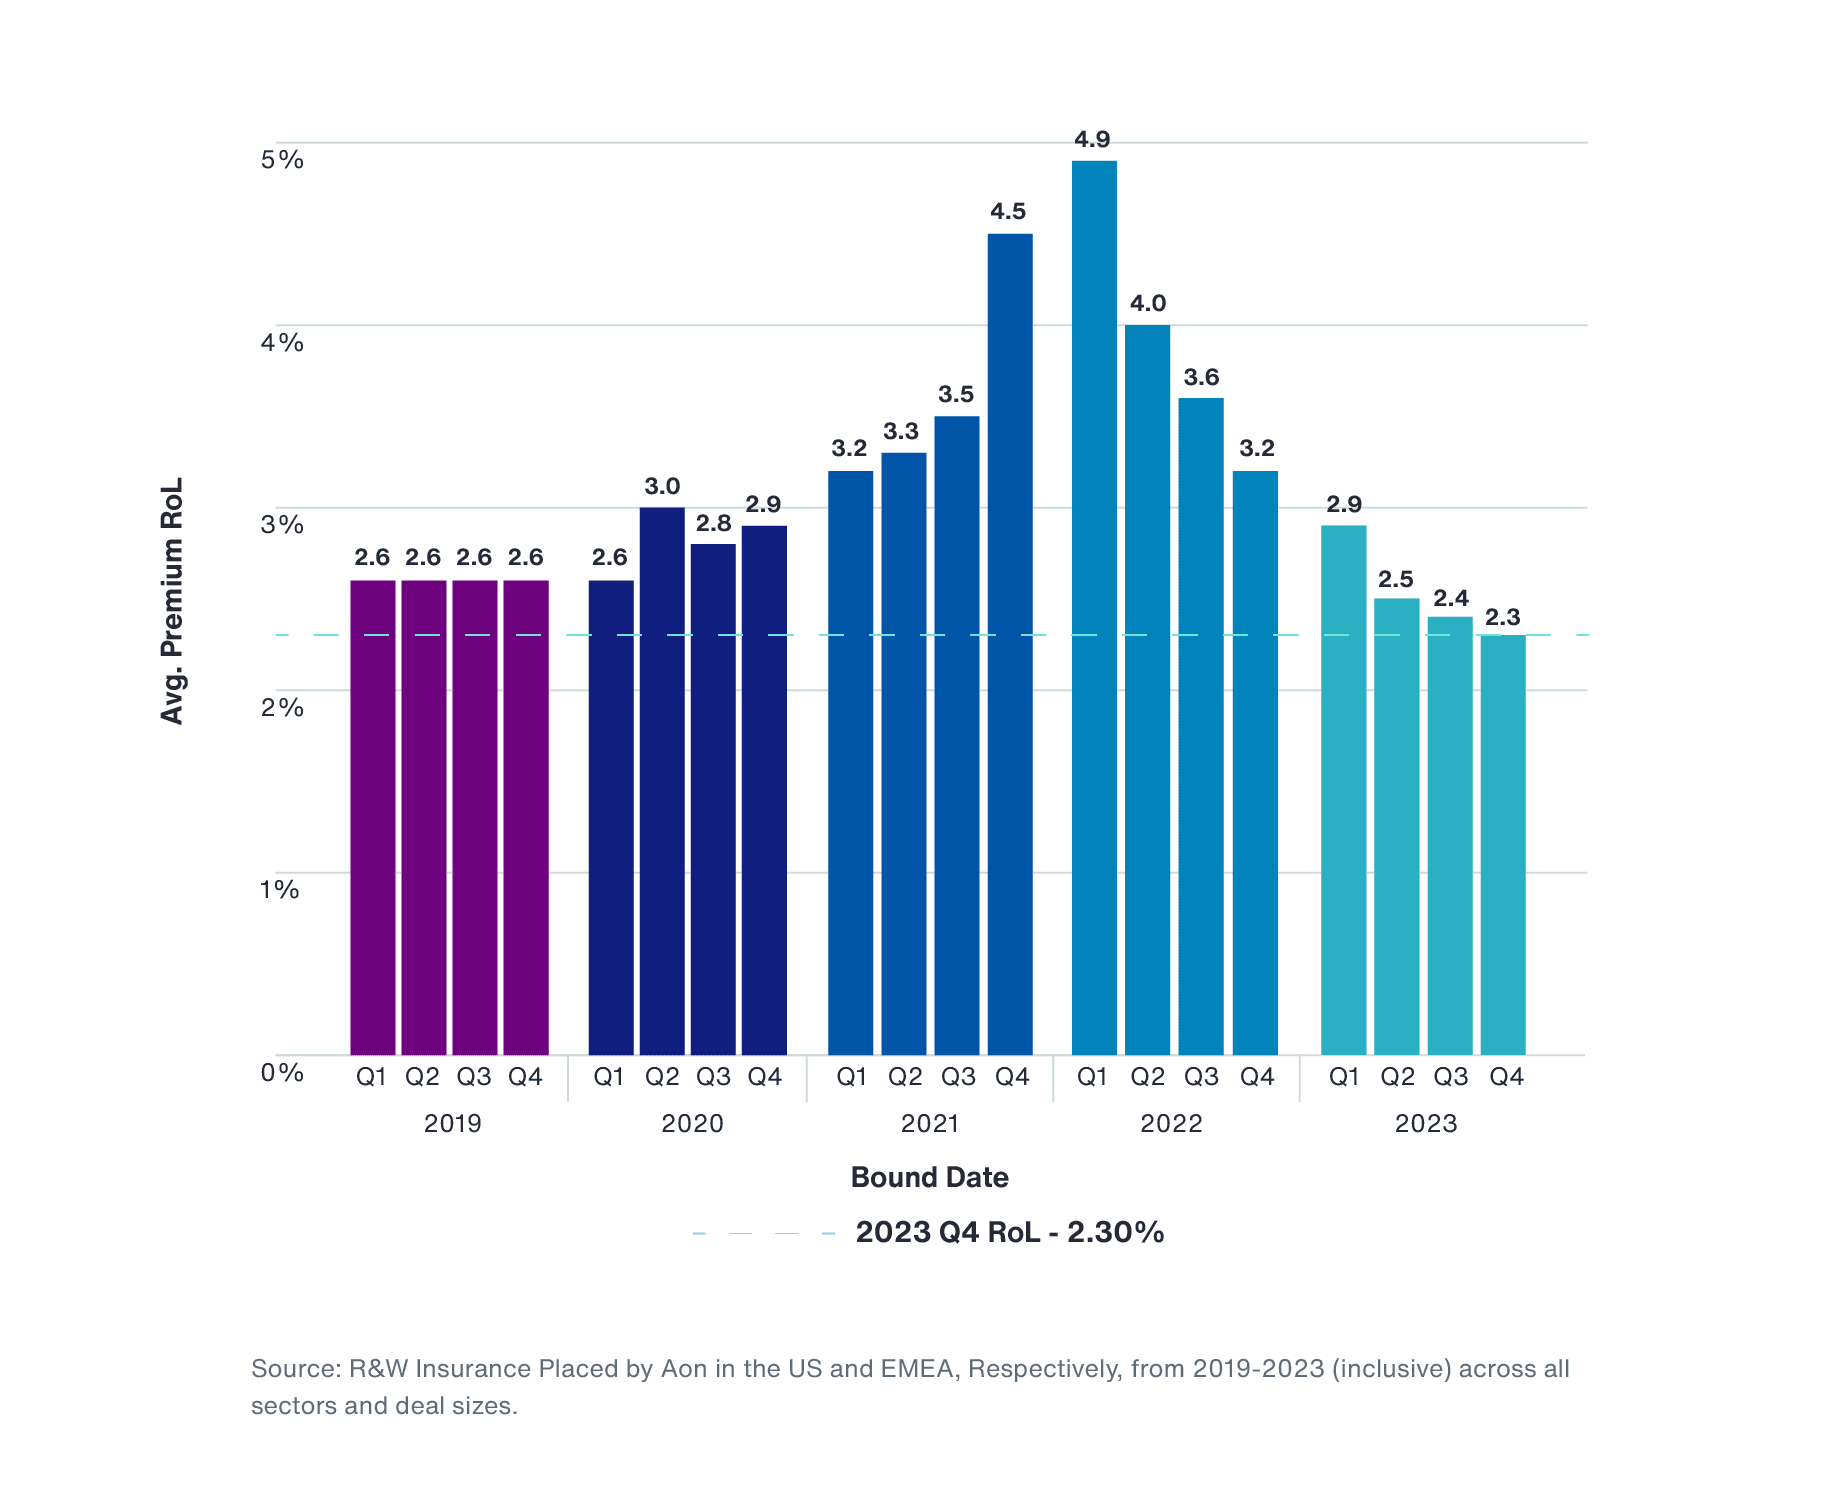
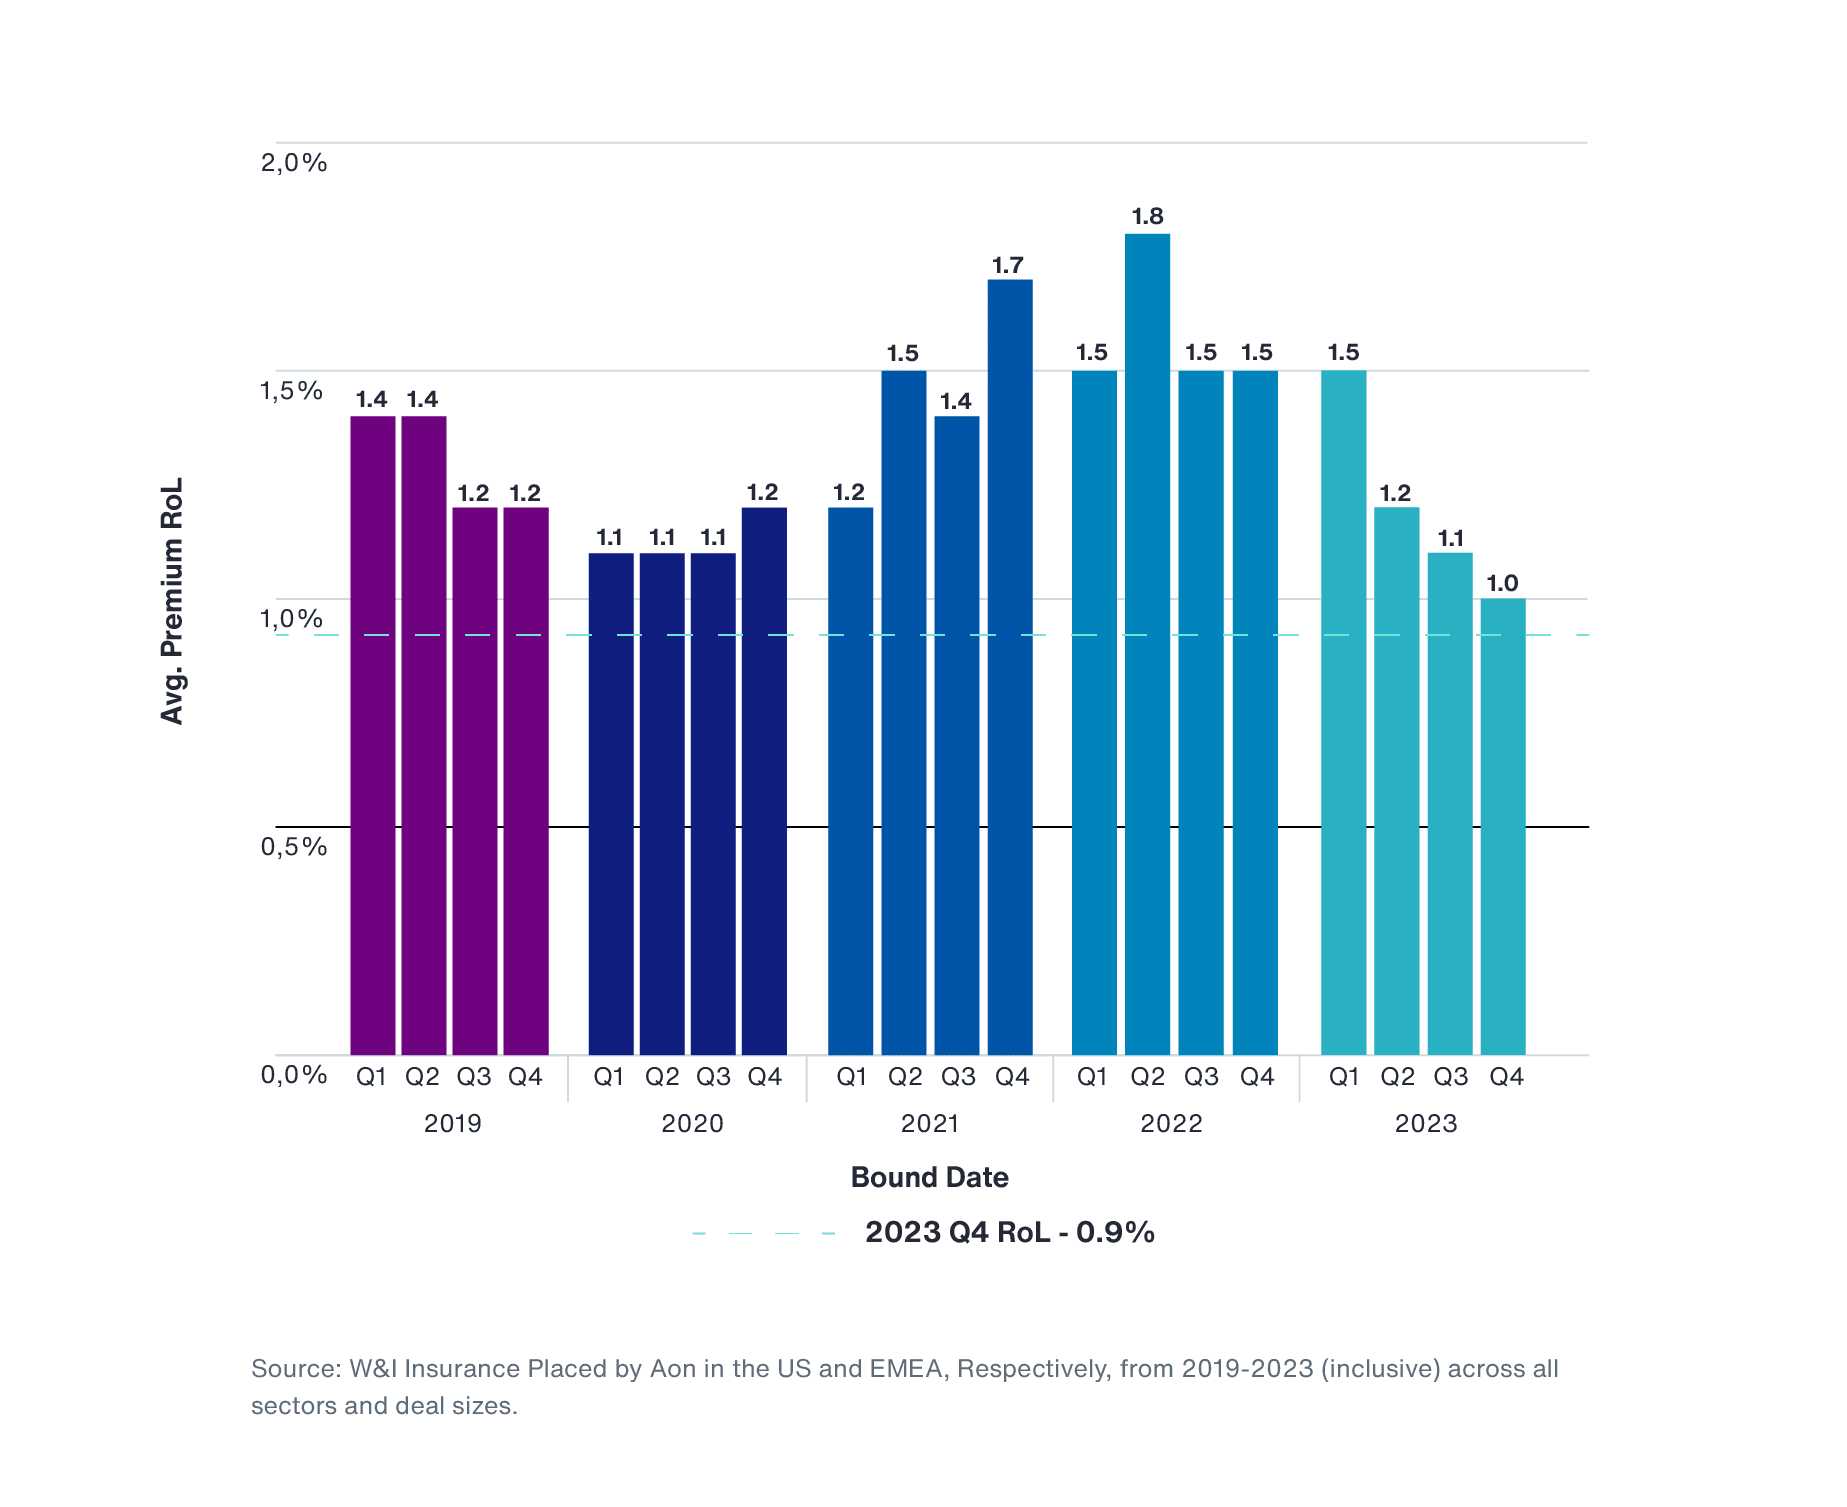
By the fourth quarter of 2023, both the U.S. and EMEA experienced the lowest average quarterly pricing1 recorded by Aon in the last five years - from before, during and since the pandemic - for R&W (2.3%) and W&I (1.0%) insurance, respectively (see figure 1).
This development is hardly surprising, given that the increased amount of risk capital flowing into the market in response to the post-pandemic spike has had to hunt harder for deals to underwrite as M&A volumes sank in 2023. As at Q2 2024, R&W and W&I pricing continues to remain highly competitive, with rates and retentions remaining favourable even as the pace of deals in the M&A market improves.
Aside from softer rates, positive client developments include improved underwriting capability as insurers in the U.S. and EMEA recruit talent with sector specialism in areas like technology and life sciences. This marks a key passage in the maturing of M&A insurance given that risk transfer, as a solution, has traditionally been sector agnostic -more designed simply to wrap the underlying deal. Acknowledgement by insurers that quality coverage plays a key part in competing on risk augurs well for clients.
As a result, underwriters show greater risk appetite and require fewer exclusions for certain sectors traditionally viewed as more challenging, such as financial services, energy and healthcare. We have seen typical exclusions - including for matters such as capital adequacy, cyber security, condition of assets and secondary tax liabilities - removed either where due diligence provides sufficient insight, or it can otherwise be shown that the risk has been sensibly addressed by the buyer (contractually, for instance).
Capability Overview
Mergers and Acquisitions (M&A)
Certain aspects of R&W cover have continued to feature more frequently on insured deals in EMEA, driven by continued inward U.S. investment and a desire for these buyers to transfer deal risk on terms with which they and their advisers are more familiar. A hybrid, 'trans-Atlantic' approach has evolved, which helps U.S. acquirers of EMEA assets effectively bridge their M&A insurance cover and adopt an investment protection approach more akin to their domestic deal practice and, as a result, bring greater execution efficiency. Specific accommodations to give these clients more of a R&W look and feel include data room 'scrapes' (i.e. disregarding general disclosure of the data room for purposes of the policy); removal of the policy de minimis; a broader definition of loss; and more streamlined specific warranty exclusions or amendments. While, traditionally, these features have often been linked to whether the underlying transaction documents more closely resemble a U.S. or European deal, insurers show continued flexibility, where appropriate, to offer enhancements on a 'synthetic' basis. This could include, for instance, a data room scrape even if the data room is 'Disclosed' in the transaction documentation.
With buyer diligence often going deeper and broader - cyber security, technology and ESG, to name a few - and parties taking more time to negotiate and execute terms in a leaner deal environment, the adage that better deal insights result in better deal protection certainly remains true. As we mention below, having one eye on relevant R&W/W&I claims experience when scoping diligence at the kick-off stage can help clients plan their deals and anticipate areas of focus, reducing the scope for unwelcome coverage surprises during the underwriting of M&A insurance.
Insurers continue to engage with ideas which either enhance existing solutions or expand how insurance can be applied to deals.
Interim Breach and Excess Solution (IBEX), recently launched by Aon, is an example of the former, covering breach of representation and/or warranty which both occurs and is discovered in between the signing and closing of the deal. Traditionally excluded from R&W and W&I insurance policies (save for rare exceptions), IBEX has gained in popularity as insurers demonstrate continued willingness to respond positively and help clients de-risk the pre-closing period of their deals.
An example of the latter can be seen in real estate M&A, where clients acquiring UK assets can now streamline W&I and title cover into a single Aon proprietary solution (ACRES), eliminating the coverage, cost and process inefficiencies of having different policies.
Claims2 performance is becoming a key differentiator, especially where there may be little daylight on terms and pricing in a tight deals market, and insights on an insurer's claims track record come to the fore to help clients make an informed insurer selection decision at the pre-underwriting stage. Many insurers also now produce their own claims studies to demonstrate that their policies will respond to, and pay out on, valid claims.
A more proactive claims approach is evident when issues surface post-acquisition, as clients look harder at their 'value protection on investment'; notably, 2023 saw two reported cases on W&I insurance claims in the English courts, with an even rarer appeal judgment on one of these being handed down in May 20243 which provides helpful guidance on how to interpret exclusions in insurance policies governed by English law and how the English courts will resolve alleged inconsistencies in both the language used and the contract as a whole.
As at Q2 2024, for Aon-placed policies we have now seen more than 1,000 claims filed in North America, and aggregate paid claims (net of deductibles erosion) of more than $1.25 billion for Aon clients in North America.
For the same period - as at Q2 2024 - in EMEA, we have seen approximately 300 claims for Aon-placed policies notified, and aggregate paid claims (net of deductibles erosion) of approximately $140 million for Aon clients in EMEA.
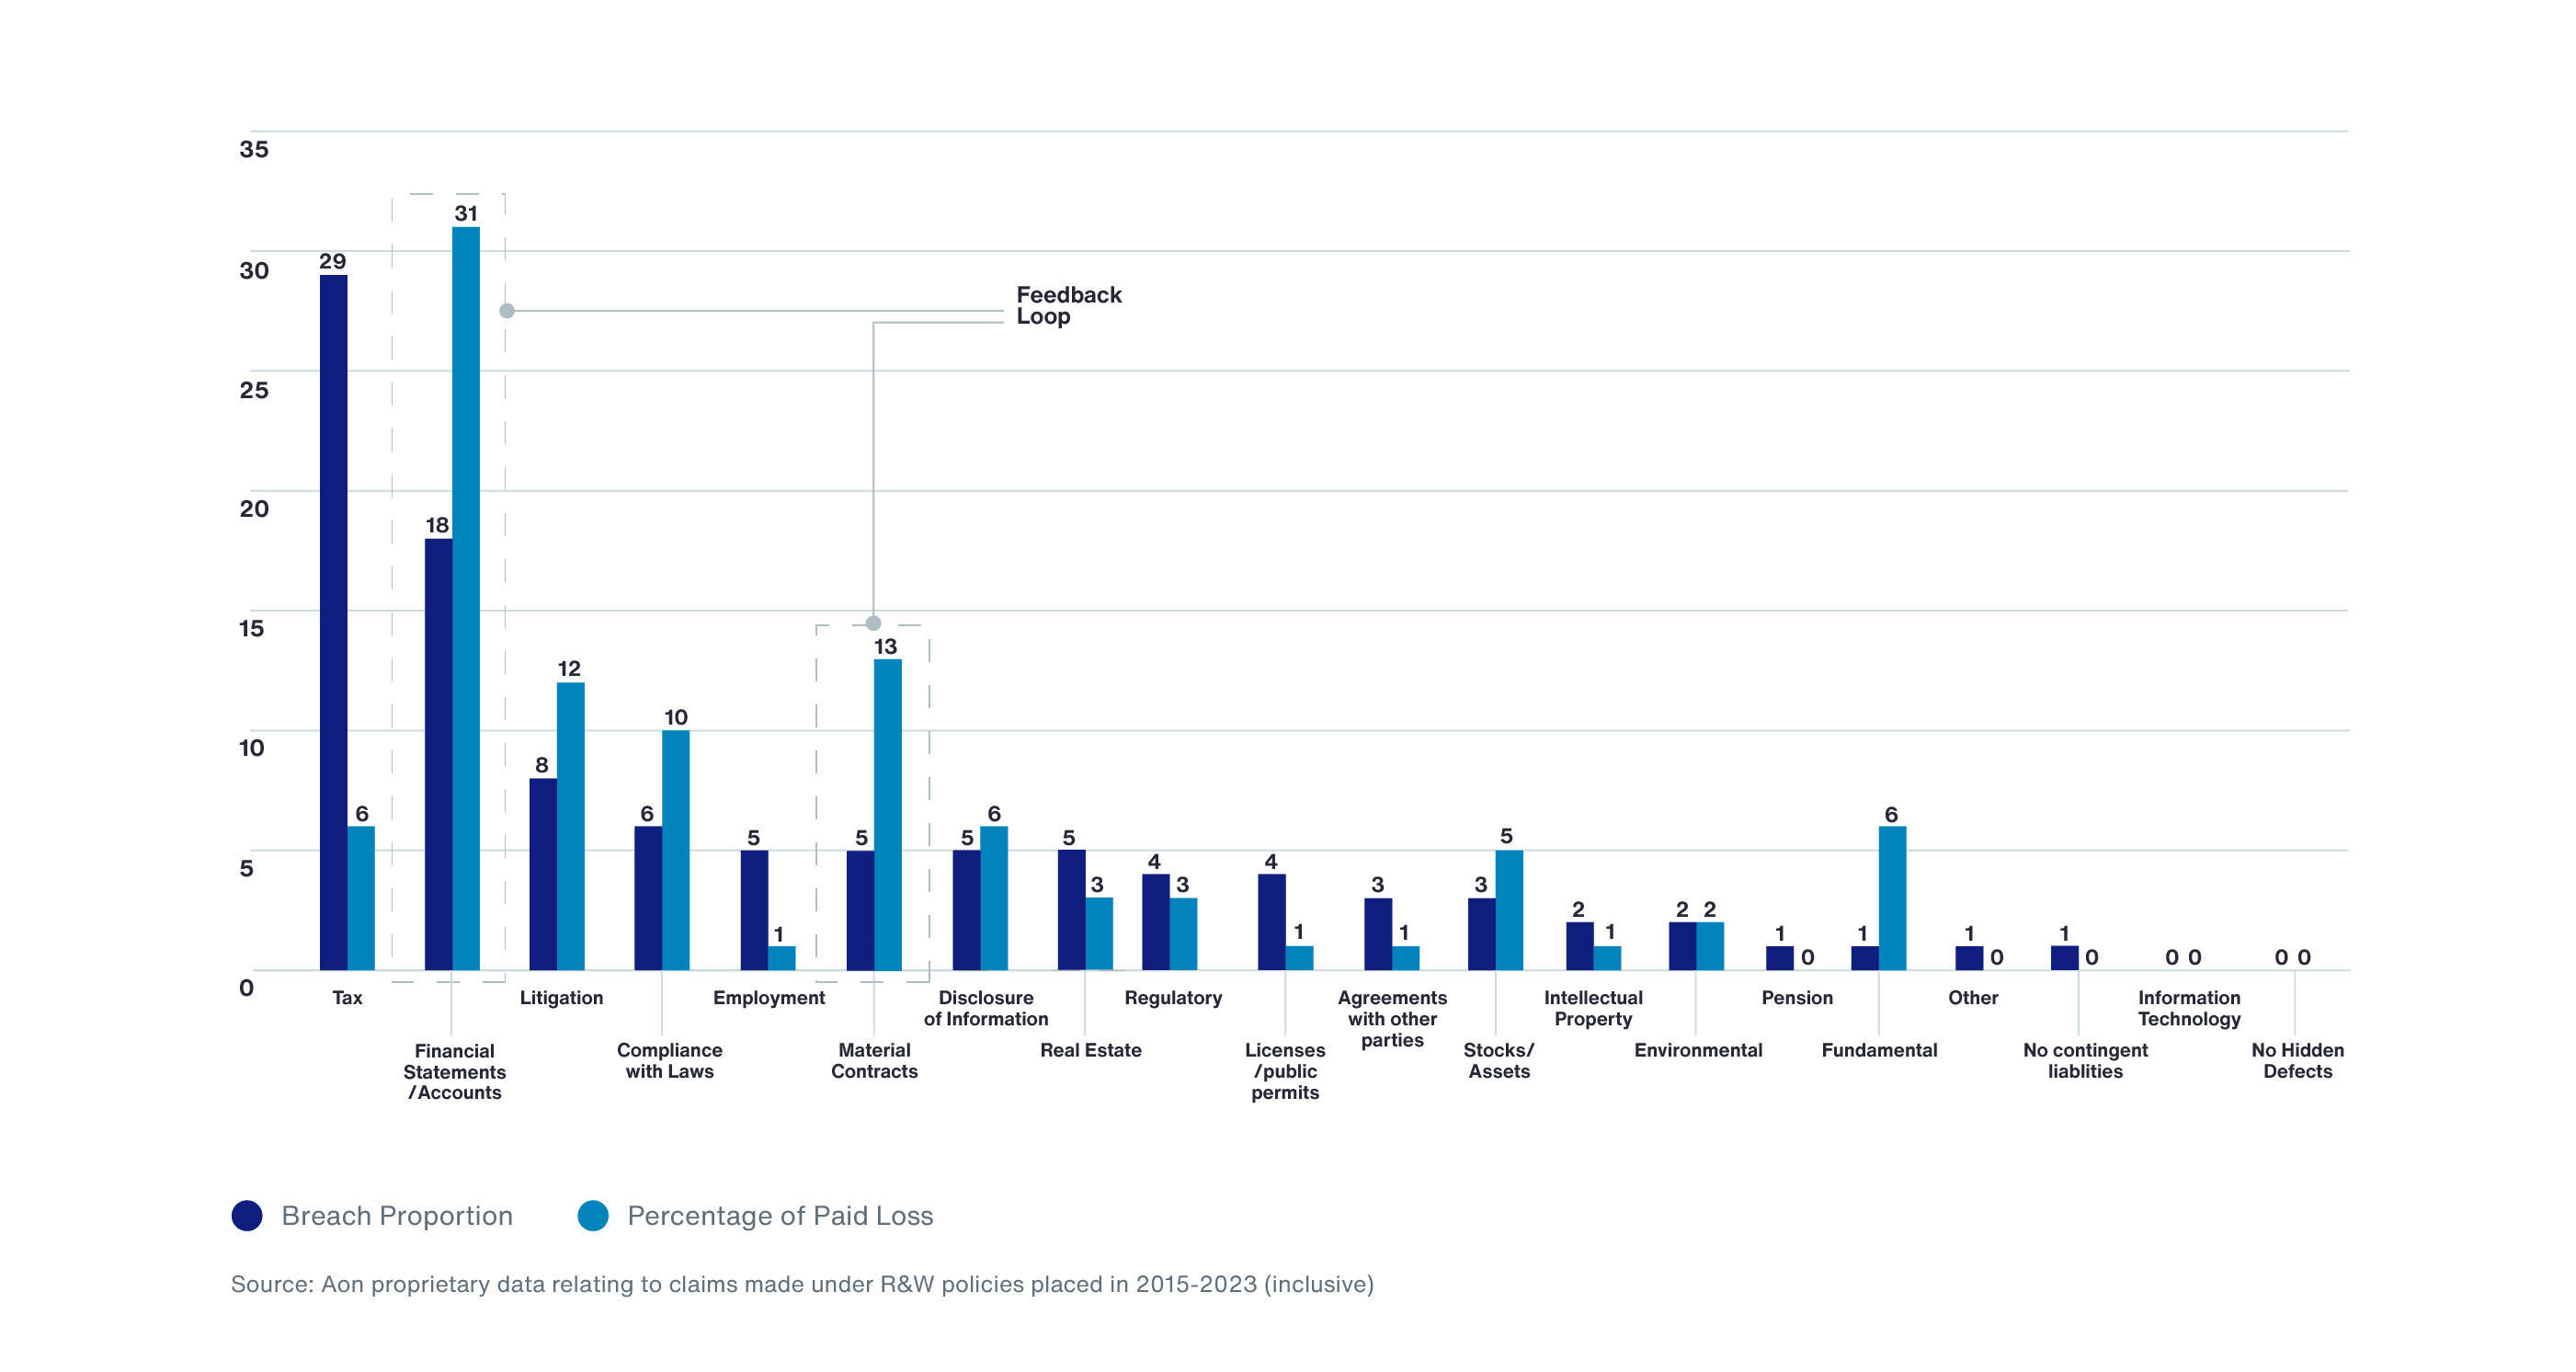
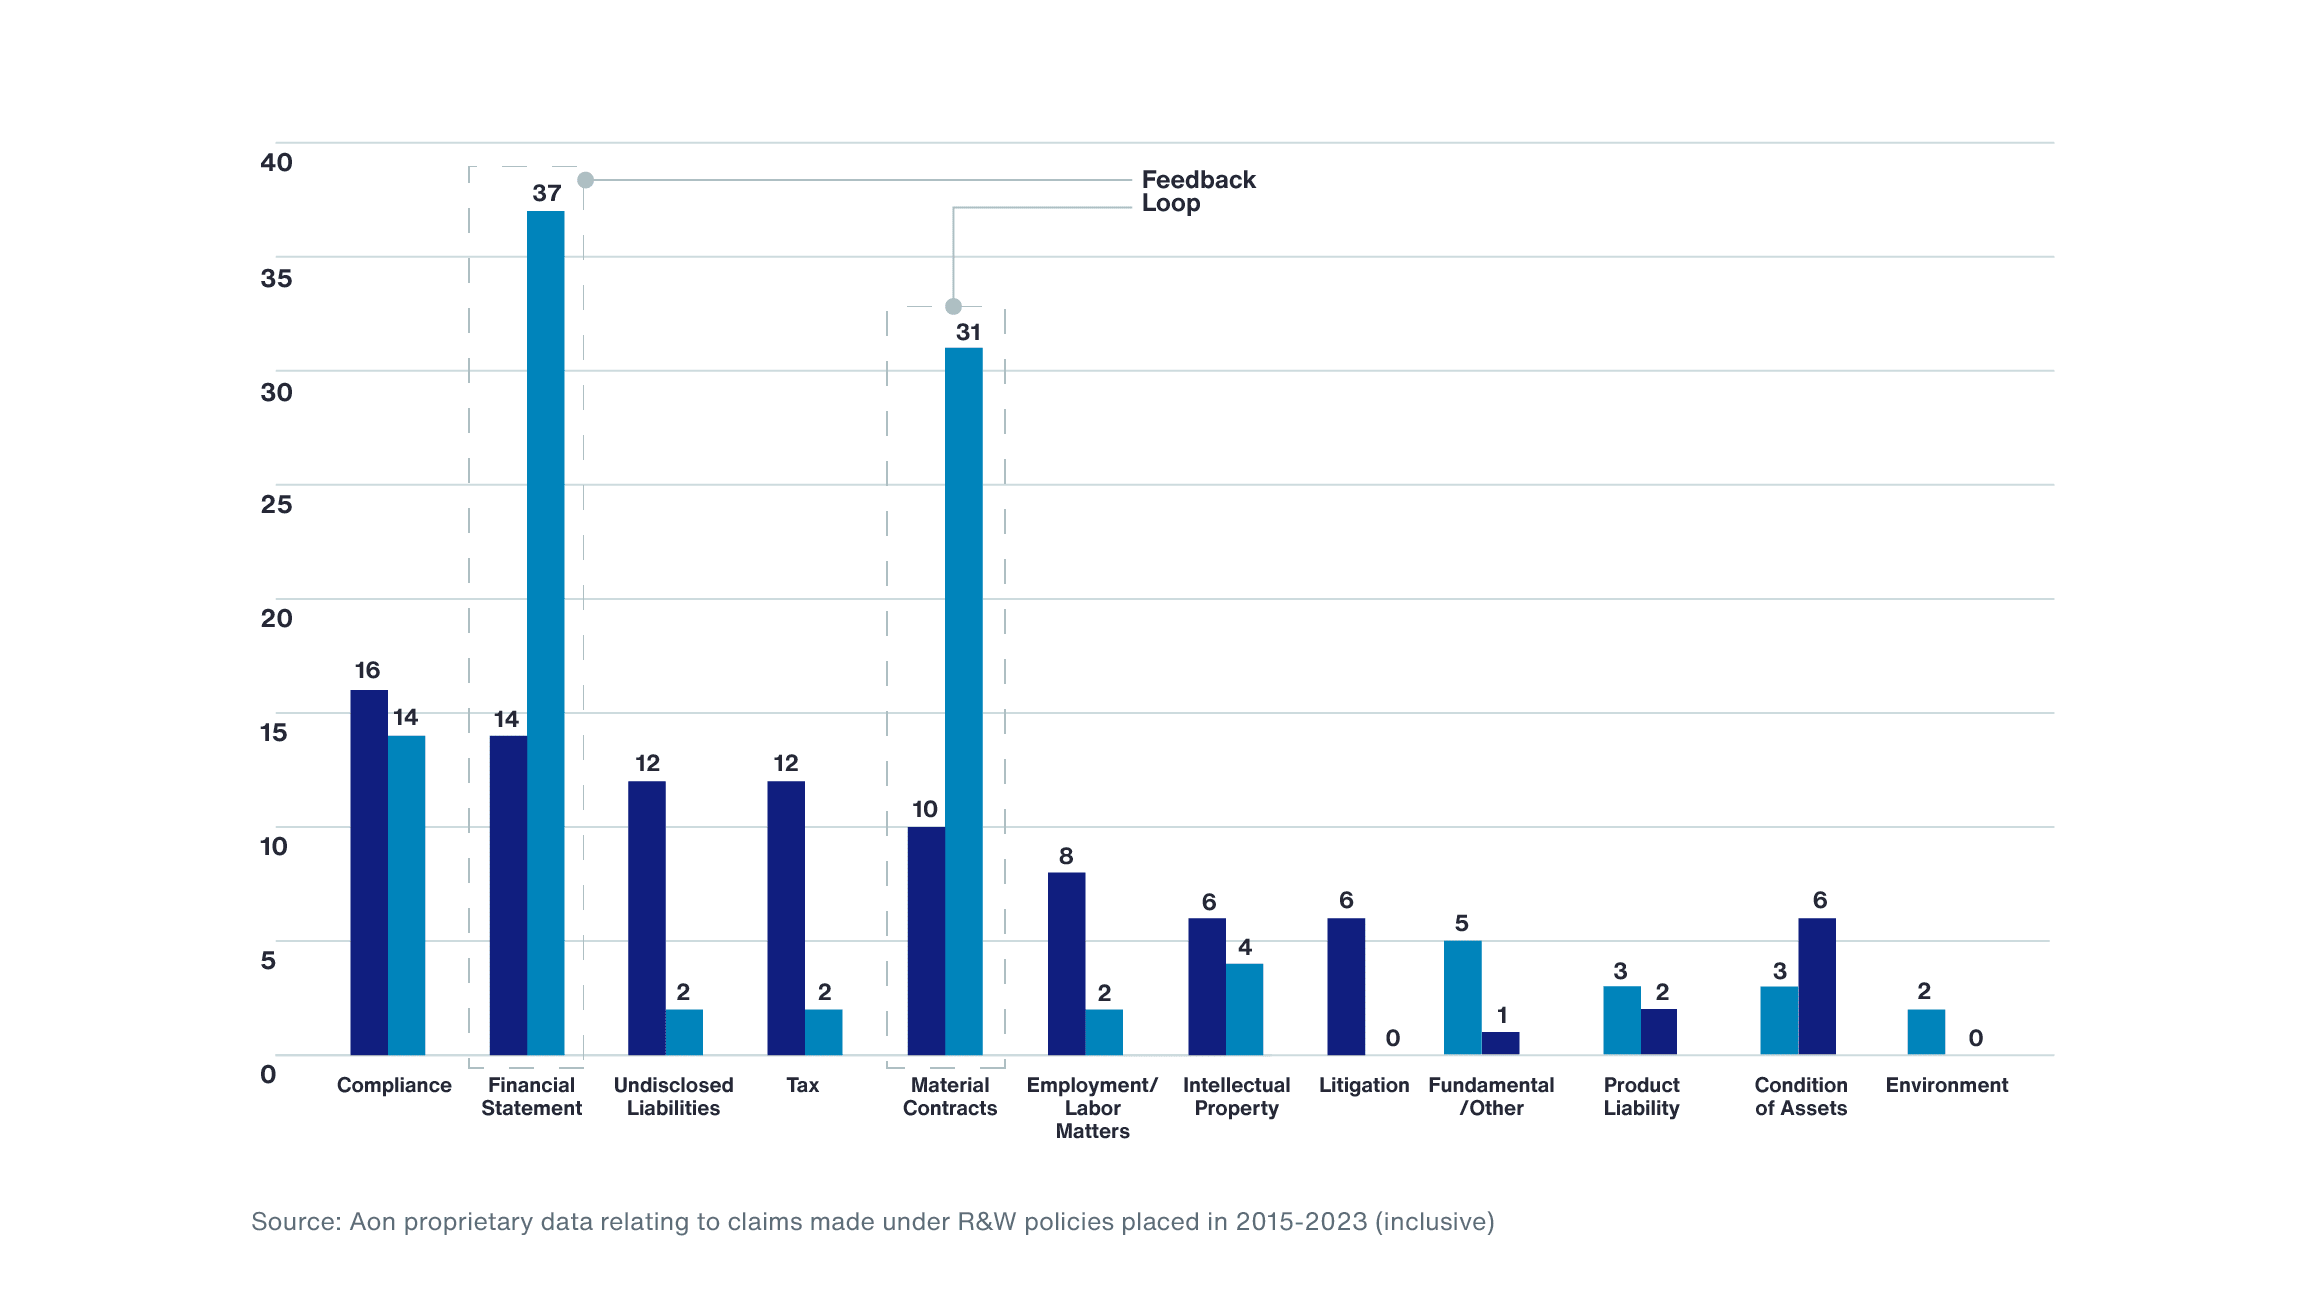
Figures 3 and 4 illustrate certain warranty hot spots based on Aon's claims data for the last seven and nine years for EMEA and the US, respectively. Broad categories of warranty which cluster the highest number of claims under both R&W policies in the US and W&I policies in EMEA placed by Aon are:
compliance with laws (16.3% US; 5.5% EMEA); financial statements (14.4% US; 17.8% EMEA); tax (11.5% US; 28.3% EMEA); and material contracts (9.9% U.S.; 5.0% EMEA)
In addition, a relatively high number of claims are made under R&W policies for breach of undisclosed liabilities representations (11.9%) in the U.S. and a relatively high number of claims are made under W&I policies for breach of litigation (7.8%) and employment (5.0%) warranties in EMEA.
There is some parity between the U.S. and EMEA in terms of average claims pay-out for certain types of warranty breach over the same seven- and nine-year period, with breaches of financial statements (37.0% U.S.; 30.9% EMEA) and material contracts (30.70% U.S.; 12.9% EMEA) attracting the most paid loss in both regions. It is notable that both these areas show a much higher proportion of actual claims paid relative to claims made, suggesting a lower claims volume but significantly higher financial impact.
Given that losses arising from breach of financial statements and material contracts tend to impact the purchase price paid for the acquired company (and loss may be claimable on a multiplied basis, depending on the European jurisdiction), it is perhaps not surprising that these warranties represent the biggest drivers of loss.
Given this pattern across both the U.S. and EMEA regions from this claims analysis, we suggest a valuable 'feedback loop' can be identified which helps clients and their advisers factor this experience into their diligence scoping and materiality thresholds at the kick-off stage for the next M&A deal.
Awareness of this feedback loop ensures not only that R&W/ W&I cover can be optimized for the client by positioning and calibrating the due diligence appropriately from the outset; it also means that some of the potential underwriting hotspots referred to under Coverage can be anticipated to achieve more efficient deal execution.
Tax insurance continues to be the go-to solution globally to address known tax risks excluded by R&W and W&I policies and today can also be used around the world to add certainty to tax outcomes facing companies and other tax-payers where there is no third party transaction, such as an internal corporate reorganization or transfer pricing concerns.
In the U.S., tax credits have long been a favoured way of incentivizing investment and part of the tax insurance landscape. In fact, protecting purchasers of investment tax credits in the 1980s was the objective of the original tax insurance policies. Today, the renewable energy industry is heavily relying on tax insurance as a means to facilitate the tax equity financing of renewables projects.
The recent enactment of the Inflation Reduction Act (IRA) in the U.S. is spurring huge growth in investments in renewable energy projects and has secured tax credits as one of the primary federal incentives to encourage investment in solar, wind, and other renewable energy asset classes. With the introduction of the ability to transfer the tax credits as a result of the IRA, we are now also seeing tax credit buyers and tax credit sellers protected by tax credit insurance.
As a result of the IRA, the amount of tax credits that are being insured on any given project are increasing primarily as a result of the new tax credit 'adders'.4 These adders allow for a project to qualify for a higher tax credit percentage than they otherwise would have prior to the passage of the IRA. Some of the types of adders available include projects that use domestic content (products produced in the U.S.), projects that are located in an 'energy community' (i.e., an area with significant employment related to coal, oil, or natural gas), and/or that the project is in a low-income community. Tax credit insurance is providing certainty that projects will qualify for these adders.
This article was written by Aon's M&A and Transaction Solutions team as contribution to the Global M&A Intelligence Report 2024 by DLA PIPER.
1 Determined as the cost of M&A insurance (premium) divided by the amount of insurance limit purchased, expressed as a percentage; also known as the 'rate on line' (note: this is not the all-in-client cost and does not fully include brokerage, insurer diligence fees and premium taxes).
2 Aon's Transaction Solutions Global Claims Study, published in May 2024, includes an analysis of Aon's proprietary claims data and results of its survey of the broader claims experience of insurers in both the US and EMEA, the first such analysis of its kind.
3 Finsbury Food Group Plc v AXIS Corporate Capital UK Ltd & Ors [2023] EWHC 1559; and Project Angel Bidco Ltd (In Administration) v Axis Managing Agency Ltd & Ors [2024] EWCA Civ 446 (02 May 2024).
4 A bonus to the amount of tax credit provided certain criteria are met.
General Disclaimer
This document is not intended to address any specific situation or to provide legal, regulatory, financial, or other advice. While care has been taken in the production of this document, Aon does not warrant, represent or guarantee the accuracy, adequacy, completeness or fitness for any purpose of the document or any part of it and can accept no liability for any loss incurred in any way by any person who may rely on it. Any recipient shall be responsible for the use to which it puts this document. This document has been compiled using information available to us up to its date of publication and is subject to any qualifications made in the document.
Terms of Use
The contents herein may not be reproduced, reused, reprinted or redistributed without the expressed written consent of Aon, unless otherwise authorized by Aon. To use information contained herein, please write to our team.
Our Better Being podcast series, hosted by Aon Chief Wellbeing Officer Rachel Fellowes, explores wellbeing strategies and resilience. This season we cover human sustainability, kindness in the workplace, how to measure wellbeing, managing grief and more.

Podcast 23 mins
Better Being Series: Understanding Burnout in the Workplace
Podcast 14 mins
Better Being Series: Why Nutrition Matters
Podcast 10 mins
Better Being Series: Discover the ‘Blue Zones’ Where People Live Longer
Podcast 20 mins
Better Being Series: Improving Your Financial Wellbeing
Podcast 17 mins
Better Being Series: Are You Taking Care of Your Digital Wellbeing?
Podcast 19 mins
On Aon Podcast: Better Being Series Dives into Women’s Health
Podcast 25 mins
On Aon’s Better Being Series: Managing Loss and GriefExpert Views on Today's Risk Capital and Human Capital Issues

Article 8 mins
Thriving in an Interconnected World: How the C-Suite Embraces Uncertainty
Article 6 mins
Powering Progress: Collaborating to Build a Sustainable Future in Emerging Markets
Article 5 mins
Building Business Resilience: Key Steps to Effectively Integrate Risk Management Across Your Organisation
Article 7 mins
Why Humans Are the Essential Factor in the Success of Artificial Intelligence (AI)
Article 5 mins
Leveraging Research and Expertise to Strengthen Your HR Strategy for 2025 and Beyond
Article 5 mins
Managing Risk on the Energy Transition Journey
Article 7 mins
The Role of Risk Management in the Age of Generative Artificial Intelligence
Article 7 mins
Finding A Way In Asia Pacific's New Economic Reality
Article 4 mins
Three Ways to Boost Value from Benefits: APAC Insights from LinkedInExpert Views on Today's Risk Capital and Human Capital Issues

Article 3 mins
Article Template to DuplicateExpert Views on Today's Risk Capital and Human Capital Issues

Article 2 mins
Introduction: Clarity and Confidence to Act Now
Article 11 mins
Navigating a New Age of Macroeconomic Uncertainty
Article 3 mins
Making Better Decisions — A C-Suite Perspective
Article 3 mins
Understanding the Dynamics of Today’s Workforce — Reward, Retain, Evolve
Article 3 mins
Artificial Intelligence — Managing the Risk and Potential
Article 10 mins
Unlocking Balance Sheet Value to Empower Your Business Strategy
Article 3 mins
Navigating the Unpredictable: Aon’s Suite of Actionable Analytics
Article 4 mins
Redefining Risk Capital as a Business Enabler: Veolia's Innovative Approach
Article 9 mins
A Data-Driven Approach to Better Workforce Decisions
Article 5 mins
The Importance of Pay Transparency
Article 6 mins
How Human Capital Data Enhances Risk Management for Financial Institutions
Article 4 mins
The Battle for Top Talent in the Professional Services Sector
Article 5 mins
Insights on a Volatile World — Risk Factors That Businesses Need to be MonitoringBetter Decisions Across Interconnected Risk and People Issues.

Article 3 mins
Acknowledging Our Complex Reality
Article 10 mins
Trade in a Technology-Driven Future
Article 9 mins
How AI and Workforce will Intersect: Navigating Risks and Opportunities
Article 8 mins
Weather and Workforce: Employers Must Quantify the Risk
Article 9 mins
Steering Trade and Supply Chains Amid Weather Challenges
Report 13 mins
Trade Issues Confront Global Businesses on Multiple Fronts
Report 19 mins
Technology is Driving Firms to Harness Opportunities and Defend Against Threats
Report 19 mins
Climate Analytics Unlock Capital to Protect People and Property
Report 14 mins
A Workforce in Transition Prepares to Meet a Host of ChallengesThe construction industry is under pressure from interconnected risks and notable macroeconomic developments. Learn how your organization can benefit from construction insurance and risk management.

Article 8 mins
How North American Construction Contractors Can Mitigate Emerging Risks
Article 7 mins
Managing Construction Risks: 7 Risk Advisory Steps
Article 7 mins
Unlocking Capacity and Capital in a Challenging Construction Risk Market
Article 7 mins
Protecting North American Contractors from Extreme Heat Risks with Parametric
Article 5 mins
How Climate Modeling Can Mitigate Risks and Improve Resilience in the Construction Industry
Report 1 mins
Construction Risk Management Europe Report 2023
Article 8 mins
Parametric Can Help Mitigate Extreme Heat Risks for Contractors in EMEAOur Cyber Resilience collection gives you access to Aon’s latest insights on the evolving landscape of cyber threats and risk mitigation measures. Reach out to our experts to discuss how to make the right decisions to strengthen your organization’s cyber resilience.

Article 8 mins
Cyber and E&O Market Conditions Remain Favorable Amid Emerging Global Risks
Article 7 mins
How to Navigate AI-Driven Cyber Risks
Article 9 mins
Building Resilience in a Buyer-Friendly Cyber and E&O Market
Article 11 mins
A Middle Market Roadmap for Cyber Resilience
Article 7 mins
Lessons Learned from the CrowdStrike Outage: 5 Strategies to Build Cyber Resilience
Article 8 mins
Responding to Cyber Attacks: How Directors and Officers and Cyber Policies Differ
Article 6 mins
Why Now is the Right Time to Customize Cyber and E&O ContractsOur Employee Wellbeing collection gives you access to the latest insights from Aon's human capital team. You can also reach out to the team at any time for assistance with your employee wellbeing needs.

Article 8 mins
Employer Strategies for Cancer Prevention and Treatment
Article 6 mins
The Long-Term Care Conundrum in the United States
Article 9 mins
Developing a Paid Leave Strategy That Supports Workers and Their Families
Article 9 mins
4 Ways to Foster a Thriving Workforce Amid Rising Health Costs
Article 9 mins
The Next Evolution of Wellbeing is About Performance
Article 6 mins
Three Ways Collective Retirement Plans Support HR Priorities
Article 9 mins
How the Right Employee Wellbeing Strategy Impacts Microstress and Burnout at Work
Podcast 13 mins
On Aon Podcast: The Future of Healthcare: Key Factors Impacting Medical Trend Rates
Article 7 mins
Making Wellbeing Part of a Company’s DNA
Article 7 mins
A Comprehensive Approach to Financial WellbeingExplore Aon's latest environmental social and governance (ESG) insights.
Our Global Insurance Market Insights highlight insurance market trends across pricing, capacity, underwriting, limits, deductibles and coverages.

Article 12 mins
Q4 2023: Global Insurance Market Overview
Article 13 mins
Top Risk Trends to Watch in 2024Better Decisions Across Interconnected Risk and People Issues.

Report 28 mins
A New Era of Converging Risks and Accelerating Disruption
Article 1 mins
Top 10 Global Risks
Article 1 mins
Industry Insights
Article 1 mins
Regional Results
Article 41 mins
Country-Level Findings
Report 5 mins
Methodology and Respondent DemographicsHow do the top risks on business leaders’ minds differ by region and how can these risks be mitigated? Explore the regional results to learn more.

Article 12 mins
Rethinking Resilience: Addressing Asia Pacific’s Top Risks
Article 10 mins
Turning Uncertainty into Opportunity: Managing Risk in the EMEA Region
Article 10 mins
Latin America’s Risk Landscape: Turning Complexity into Competitive Advantage
Article 10 mins
Rethinking Resilience: Navigating North America’s Evolving Risk LandscapeExplore Aon's corporate sustainability impact and strategy.

Article 7 mins
Executive Summary
Article 13 mins
Environmental Sustainability
Article 15 mins
Supporting Energy Resilience and Transition to Low-Carbon Economy
Article 23 mins
Our Commitment to Our Colleagues
Article 8 mins
Community Impact
Article 9 mins
Governance
Article 8 mins
Cyber and Data Security
Article 11 mins
Redefine ResilienceTrade, technology, weather and workforce stability are the central forces in today’s risk landscape.

Article 6 mins
Cyber Risk: Turning Uncertainty into Opportunity
Article 7 mins
Business Interruption: Managing Risk in an Interconnected World
Article 6 mins
Why Economic Slowdown is an Ongoing Risk for Organizations
Article 8 mins
Navigating Regulatory and Legislative Change
Article 5 mins
Increasing Competition Is Intensifying Risk for Organizations
Article 7 mins
Commodity Price Risk and Material Scarcity: An Escalating and Complex Risk
Article 9 mins
Supply Chain or Distribution Failure: Navigating the New Normal
Article 5 mins
Damage to Reputation or Brand: A Critical Risk
Article 6 mins
Geopolitical Volatility: Preparing for the Unpredictable
Article 6 mins
Cash Flow and Liquidity Risk: A Rising ChallengeThese industry-specific articles explore the top risks, their underlying drivers and the actions leaders are taking to build resilience.

Article 9 mins
Building Resilience to Support Growth in Construction and Real Estate
Article 10 mins
Managing Risk and Unlocking Opportunity in the Food, Agribusiness and Beverage Industry
Article 8 mins
Adapting to Disruption: How Financial Institutions are Reframing Risk
Article 10 mins
Turning Risk into Resilience in the Industrials and Manufacturing Industry
Article 11 mins
Navigating Risk in Insurance: Turning Complexity into Competitive Advantage
Article 10 mins
Navigating Risk in Life Sciences: Building Resilience to Support Growth
Article 11 mins
Navigating Volatility in Natural Resources: Risk Management as a Value Driver
Article 10 mins
Navigating Risk in Transportation and Logistics: Gearing Up for Big Transitions
Article 9 mins
Technology, Media and Communications: Rethinking Risk in a Shifting LandscapeOur Human Capital Analytics collection gives you access to the latest insights from Aon's human capital team. Contact us to learn how Aon’s analytics capabilities helps organizations make better workforce decisions.

Article 35 mins
5 Human Resources Trends to Watch in 2025
Article 13 mins
Medical Rate Trends and Mitigation Strategies Across the Globe
Article 9 mins
3 Strategies to Help Avoid Workers Compensation Claims Litigation
Podcast 15 mins
On Aon Podcast: Using Data and Analytics to Improve Health Outcomes
Article 14 mins
How Technology Will Transform Employee Benefits in the Next Five Years
Podcast 18 mins
On Aon Podcast: Technology Impacting the Future of Health and Benefits
Article 11 mins
Designing Tomorrow: Personalizing EVP, Benefits and Total RewardsRead our collection of human capital articles that explore in depth hot topics for HR and risk professionals, including using data and analytics to measure total rewards programs, how HR and finance can better partner and the impact AI will have on the workforce.

Article 12 mins
Total Rewards Strategies That Drive Business Outcomes
Article 35 mins
5 Human Resources Trends to Watch in 2025
Article 20 mins
5 Ways HR Can Partner with Finance to Drive Growth
Article 15 mins
How Artificial Intelligence is Transforming Human Resources and the Workforce
Article 15 mins
Five Big Human Resources Trends to Watch in 2024
Article 11 mins
Designing Tomorrow: Personalizing EVP, Benefits and Total Rewards
Article 10 mins
How Data and Analytics Can Optimize HR Programs
Article 15 mins
Get Ready for the Top 5 HR Trends in 2023Explore our hand-picked insights for human resources professionals.

Article 7 mins
COVID-19 has Permanently Changed the Way We Think About Wellbeing
Article 10 mins
How Data and Analytics Can Optimize HR Programs
Article 7 mins
Case Study: The LPGA Unlocks Talent Potential with Data
Article 10 mins
Navigating the New EU Directive on Pay Transparency
Article 7 mins
Rethinking Your Total Rewards Programs During Mergers and AcquisitionsOur Workforce Collection provides access to the latest insights from Aon’s Human Capital team on topics ranging from health and benefits, retirement and talent practices. You can reach out to our team at any time to learn how we can help address emerging workforce challenges.
Article 8 mins
Weather and Workforce: Employers Must Quantify the Risk
Article 12 mins
Total Rewards Strategies That Drive Business Outcomes
Article 8 mins
AI and Workforce Skills: Who Should Act and Why Now?
Article 19 mins
3 Strategies to Promote an Inclusive Environment and Bridge the Gender Gap
Article 8 mins
2025 Salary Increase Planning Tips
Article 12 mins
People Risks Are Rising: Here’s How U.S. Benefits Are Stepping Up
Article 8 mins
Employer Strategies for Cancer Prevention and Treatment
Article 6 mins
Taking a Data-Led Approach to Job Architecture to Accelerate Pay Transparency
Podcast 12 mins
Better Being Series: Building Sustainable Performance in a Multi-Generational Workforce
Article 7 mins
Key Trends in U.S. Benefits for 2025 and Beyond
Article 7 mins
Why Pay Transparency Demands a Total Rewards Lens
Article 9 mins
4 Ways to Foster a Thriving Workforce Amid Rising Health CostsOur Mergers and Acquisitions (M&A) collection gives you access to the latest insights from Aon's thought leaders to help dealmakers make better decisions. Explore our latest insights and reach out to the team at any time for assistance with transaction challenges and opportunities.
Article 7 mins
Rethinking Your Total Rewards Programs During Mergers and Acquisitions
Article 9 mins
Organizational Design and Talent Planning are Key to M&A Success
Article 5 mins
Project Management for HR: The Secret Behind a Successful M&A Deal
Article 8 mins
Cultural Alignment Planning Drives M&A Success
Report 1 mins
A Guide to Maximizing Value in Post-Merger Integrations
Report 2 mins
The ABC's of Private Equity M&A: Deal Flow Impacts of Al, Big Tech and Climate Change
Article 11 mins
The Silver Lining on M&A Deal Clouds: M&A Insurance Insights from 2023The challenges in adopting renewable energy are changing with technological advancements, increasing market competition and numerous financial support mechanisms. Learn how your organization can benefit from our renewables solutions.

Article 4 mins
5 Steps for Successful Carbon Accounting Verification
Article 6 mins
AI Innovations in Renewable Energy: Transforming the Sector
Article 11 mins
Securing Human Capital in Natural Resources
Article 6 mins
Decarbonizing Construction for a Low-Emission FutureHow do businesses navigate their way through new forms of volatility and make decisions that protect and grow their organizations?
Our Parametric Insurance Collection provides ways your organization can benefit from this simple, straightforward and fast-paying risk transfer solution. Reach out to learn how we can help you make better decisions to manage your catastrophe exposures and near-term volatility.

Article 10 mins
How Public Entities and Businesses Can Use Parametric for Emergency Funding
Article 6 mins
Parametric Insurance: A Complement to Traditional Property Coverage
Article 8 mins
Using Parametric Insurance to Match Capital to Climate Risk
Article 6 mins
Using Parametric Insurance to Close the Earthquake Protection Gap
Article 5 mins
How Technology Enhancements are Boosting ParametricOur Pay Transparency and Equity collection gives you access to the latest insights from Aon's human capital team on topics ranging from pay equity to diversity, equity and inclusion. Contact us to learn how we can help your organization address these issues.
Article 6 mins
Taking a Data-Led Approach to Job Architecture to Accelerate Pay Transparency
Article 19 mins
3 Strategies to Promote an Inclusive Environment and Bridge the Gender Gap
Report 1 mins
The 2024 North America Pay Transparency Readiness Study
Article 10 mins
How Financial Institutions can Prepare for Pay Transparency Legislation
Article 8 mins
Pay Transparency Can Lead to Better Equity Across Benefits
Article 12 mins
Understanding and Preparing for the Rise in Pay Transparency
Podcast 14 mins
On Aon Podcast: Understanding Pay Transparency Regulations
Article 10 mins
Navigating the New EU Directive on Pay Transparency
Article 6 mins
To Disclose Pay or Not? How Companies are Approaching the Pay Transparency Movement
Podcast 19 mins
On Aon Podcast: Better Being Series Dives into Women’s Health
Article 11 mins
Advancing Women’s Health and Equity Through Benefits and SupportForecasters are predicting an extremely active 2024 Atlantic hurricane season. Take measures to build resilience to mitigate risk for hurricane-prone properties.
Article 8 mins
Florida Hurricanes Not Expected to Adversely Affect Property Market
Article 10 mins
Build Resilience for an Extremely Active Atlantic Hurricane Season
Article 4 mins
Four Steps to Develop Strong Property Risk Coverage in a Hardening Market
Podcast 16 mins
On Aon Podcast: Navigating and Preparing for Catastrophes
Article 6 mins
Parametric Insurance: A Complement to Traditional Property Coverage
Article 4 mins
Navigating Climate Risk Using Multiple Models and Data Sets
Article 5 mins
Rising Losses From Severe Convection Storms Mostly Explained by Exposure Growth
Article 6 mins
Using Parametric Insurance to Close the Earthquake Protection GapOur Technology Collection provides access to the latest insights from Aon's thought leaders on navigating the evolving risks and opportunities of technology. Reach out to the team to learn how we can help you use technology to make better decisions for the future.
Article 9 mins
How AI and Workforce will Intersect: Navigating Risks and Opportunities
Article 23 mins
The AI Data Center Boom: Strategies for Sustainable Growth and Risk Management
Article 8 mins
AI and Workforce Skills: Who Should Act and Why Now?
Article 7 mins
How Technology is Transforming Open Enrollment in the U.S.
Article 15 mins
Navigating Cyber Risks in EMEA: Key Insights for 2025
Article 7 mins
How to Navigate AI-Driven Cyber Risks
Article 15 mins
How Artificial Intelligence is Transforming Human Resources and the Workforce
Podcast 9 mins
On Aon Podcast: How has CrowdStrike Changed the Cyber Market?
Article 12 mins
5 Ways Artificial Intelligence can Boost Claims Management
Article 12 mins
Navigating AI-Related Risks: A Guide for Directors and Officers
Article 5 mins
How Technology Enhancements are Boosting Parametric
Article 7 mins
How to Futureproof Data and Analytics Capabilities for ReinsurersOur Trade Collection gives you access to the latest insights from Aon's thought leaders on navigating the evolving risks and opportunities for international business. Reach out to our team to understand how to make better decisions around macro trends and why they matter to businesses.
Article 10 mins
Trade in a Technology-Driven Future
Podcast 9 mins
Special Edition: Global Trade and its Impact on Supply Chain
Article 8 mins
The Evolving Threat of Cargo Theft: 5 Key Mitigation Strategies
Report 1 mins
Findings from Aon's Global Risk Management Survey | Tenth Edition
Article 4 mins
Four Steps to Develop Strong Property Risk Coverage in a Hardening Market
Article 14 mins
Cutting Supply Chains: How to Achieve More Reward with Less Risk
Article 9 mins
Driving Private Equity Value Creation Through Credit Solutions
Article 7 mins
4 Steps to Help Take Advantage of a Buyer-Friendly Directors' & Officers' Market
Article 9 mins
Managing Reputational Risks in Global Supply Chains
Article 8 mins
How an Outsourced Chief Investment Officer Can Help Improve Governance and Manage Complexity
Article 8 mins
Decarbonizing Your Business: Finding the Right Insurance and Strategy
Article 8 mins
Reputation Analytics as a Leading Indicator of ESG RiskBetter Decisions Across Interconnected Risk and People Issues.

Report 5 mins
Chapter 1: Author’s Note & Executive Summary
Report 8 mins
Chapter 2: North America: Highlights, Claims Severity and Frequency
Report 3 mins
Chapter 3: North America: Breach Type and Notification
Report 24 mins
Chapter 4: North America: Industry Sectors and Trends
Report 5 mins
Chapter 5: North America: Tax Insurance Claims
Report 5 mins
Chapter 6: EMEA: Highlights and Introduction
Report 9 mins
Chapter 7: EMEA: Claim Frequency and Metrics
Report 7 mins
Chapter 8: EMEA: Notifications by Target Location and Claims Severity and Payment Trends
Report 10 mins
Chapter 9: EMEA: Breach Types and Trends
Report 7 mins
Chapter 10: EMEA: Case Law, Insurer Survey, Claims Handling and Tax
Report 6 mins
Chapter 11: APAC: Asia
Report 9 mins
Chapter 12: APAC: PacificWith a changing climate, organizations in all sectors will need to protect their people and physical assets, reduce their carbon footprint, and invest in new solutions to thrive. Our Weather Collection provides you with critical insights to be prepared.
Article 9 mins
Steering Trade and Supply Chains Amid Weather Challenges
Podcast 9 mins
On Aon Podcast: Climate Impact on the Property and Casualty Market
Alert 14 mins
L.A. Wildfires Highlight Urgent Need for Employee Support and Business Resilience
Report 3 mins
2026 Climate and Catastrophe Insight
Article 10 mins
How Public Entities and Businesses Can Use Parametric for Emergency Funding
Podcast 12 mins
On Aon Podcast: Tackling Climate Risk to Build Economic Resilience
Article 8 mins
Understanding Freeze Risk in a Changing Climate
Podcast 9 mins
On Aon Podcast: Climate Science Through Academic Collaboration
Article 6 mins
How Companies Are Using Climate Modeling to Improve Risk Decisions
Article 8 mins
Using Parametric Insurance to Match Capital to Climate Risk
Article 9 mins
Record Heatwaves: Protecting Employee Health and SafetyOur Workforce Resilience collection gives you access to the latest insights from Aon's Human Capital team. You can reach out to the team at any time for questions about how we can assess gaps and help build a more resilience workforce.
Article 12 mins
The accelerating role of artificial intelligence in organizational decision making in 2026 is redefining exposure — from fraud to operational resilience. Leaders must strengthen controls, build clear accountability, and ensure their risk and insurance programs keep pace with AI‑driven threats.

Article 8 mins
Extreme heat from climate change is increasingly threatening U.S. energy supply and reliability – forcing energy companies to take steps to safeguard operations and meet rising demand.

Article 10 mins
Aon Accelerate Lab insights on strengthening primary care as the coordinating hub of employer healthcare to improve access, outcomes and employee experience.

You will soon receive an email to verify your email address. Please click on the link included in this note to complete the subscription process, which also includes providing consent in applicable locations and an opportunity to manage your email preferences.
Article 10 Min Read
Your request is being reviewed so we can align you to the best resources on our team. In the meantime, we invite you to explore some of our latest insights below.
Article 10 Min Read
