49%
Only 49 percent of respondents said they were prepared for a cyber or Intellectual Property ‘Black Swan’ event.

Sponsored by Aon. Independently conducted by the Ponemon Institute. Published July 2024.
Cyber risk and generative artificial intelligence (Gen AI) top the list of C-suite concerns, and the likelihood of an intangible asset cyber event occurring is reported to be three times (3X) more likely than an attack on property, plant, and equipment (PP&E).
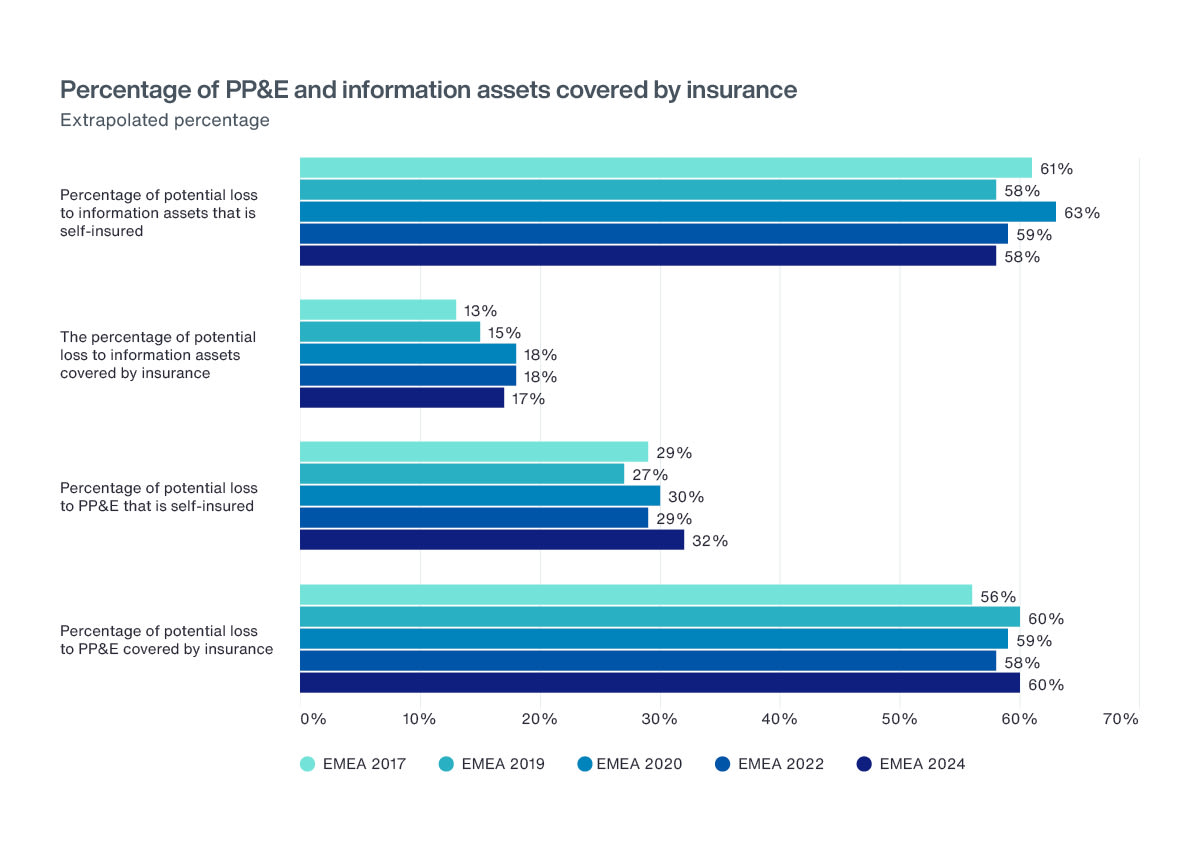
Yet, organisations report that insurance is in place to cover only 17 percent of information assets compared to 60 percent for PP&E. This underappreciation of the value of cyber insurance contributes to an insurance versus cyber risk gap, exposing many organisations to unnecessary financial exposures. This risk will grow as Gen AI lowers the barrier to entry for cyber criminals and heightens the impact of cyber attacks.
Only 49 percent of respondents said they were prepared for a cyber or Intellectual Property ‘Black Swan’ event.
This research aims to provide a better understanding of the evolving threats of generative AI, cyber and IP. It highlights the role insurance can play in protecting intangible assets to help organisations make better decisions regarding allocation of their finite resources to protect against tangible and intangible perils.
In the report, we compare the relative:

Report
The likelihood of a loss is higher for intangible assets than for tangible assets.
The average total value of intangible assets is 2.45% higher than that of tangible assets.
The average Probable Maximum Loss for intangible assets is almost 43% higher than that of tangible assets.
69% of organisations use or intend to use AI products or services.
54% of organisations had a material or significantly disruptive security exploit or data breach one or more times in the past 24 months.
While most organisations do not have specific IP insurance policies, 68% of organisations say they have an interest in purchasing them.
The consolidated sampling frame is composed of 63,112 individuals located in North America, Europe, the Middle East, Africa, Asia Pacific, Japan and Latin America. Respondents are involved in their company’s cyber risk management as well as enterprise risk management activities. 2,790 respondents completed the survey, of which 327 were rejected for reliability issues. The final sample consisted of 2,462 surveys, of which EMEA survey respondents totalled to 596.

Our Better Being podcast series, hosted by Aon Chief Wellbeing Officer Rachel Fellowes, explores wellbeing strategies and resilience. This season we cover human sustainability, kindness in the workplace, how to measure wellbeing, managing grief and more.

Podcast 23 mins
Better Being Series: Understanding Burnout in the Workplace
Podcast 14 mins
Better Being Series: Why Nutrition Matters
Podcast 10 mins
Better Being Series: Discover the ‘Blue Zones’ Where People Live Longer
Podcast 20 mins
Better Being Series: Improving Your Financial Wellbeing
Podcast 17 mins
Better Being Series: Are You Taking Care of Your Digital Wellbeing?
Podcast 19 mins
On Aon Podcast: Better Being Series Dives into Women’s Health
Podcast 29 mins
On Aon’s Better Being Series: The World Wellbeing Movement
Podcast 28 mins
On Aon’s Better Being Series: Mental Health and Creating Kinder Cultures
Podcast 25 mins
On Aon’s Better Being Series: Managing Loss and Grief
Podcast 24 mins
On Aon’s Better Being Series: Measuring Wellbeing
Podcast 25 mins
On Aon’s Better Being Series: Physical Wellbeing and Resilience
Podcast 23 mins
On Aon’s Better Being Series: Human SustainabilityExpert Views on Today's Risk Capital and Human Capital Issues

Article 8 mins
Thriving in an Interconnected World: How the C-Suite Embraces Uncertainty
Article 6 mins
Powering Progress: Collaborating to Build a Sustainable Future in Emerging Markets
Article 5 mins
Building Business Resilience: Key Steps to Effectively Integrate Risk Management Across Your Organisation
Article 7 mins
Why Humans Are the Essential Factor in the Success of Artificial Intelligence (AI)
Article 5 mins
Leveraging Research and Expertise to Strengthen Your HR Strategy for 2025 and Beyond
Article 5 mins
Managing Risk on the Energy Transition Journey
Article 7 mins
The Role of Risk Management in the Age of Generative Artificial Intelligence
Article 7 mins
Finding A Way In Asia Pacific's New Economic Reality
Article 4 mins
Three Ways to Boost Value from Benefits: APAC Insights from LinkedInExpert Views on Today's Risk Capital and Human Capital Issues

Article 3 mins
Article Title 1Expert Views on Today's Risk Capital and Human Capital Issues

Article 2 mins
Introduction: Clarity and Confidence to Make Better Decisions
Article 2 mins
The Age of Rising Resilience – An Economic Outlook
Article 3 mins
Building Resilience Against the Constant Cyber Threat
Article 2 mins
Making Better Decisions – A Treasurer’s Perspective
Article 2 mins
How to Balance the Conflicting Forces of Efficiency, Performance and Wellbeing
Article 3 mins
Seizing the Opportunity: Building a Comprehensive Approach to Risk Transfer
Article 2 mins
Tapping New Markets to Unlock Deal Value
Article 5 mins
The Rise of the Skills-Based Organisation
Article 2 mins
Creating a Fair and Equitable Workforce for Everyone
Article 3 mins
The Year of the Vote: How Geopolitical Volatility Will Impact Businesses
Article 2 mins
The Aon DifferenceBetter Decisions Across Interconnected Risk and People Issues.

Article 3 mins
Acknowledging Our Complex Reality
Article 10 mins
Trade in a Technology-Driven Future
Article 9 mins
How AI and Workforce will Intersect: Navigating Risks and Opportunities
Article 8 mins
Weather and Workforce: Employers Must Quantify the Risk
Article 9 mins
Steering Trade and Supply Chains Amid Weather Challenges
Report 13 mins
Trade Issues Confront Global Businesses on Multiple Fronts
Report 19 mins
Technology is Driving Firms to Harness Opportunities and Defend Against Threats
Report 19 mins
Climate Analytics Unlock Capital to Protect People and Property
Report 14 mins
A Workforce in Transition Prepares to Meet a Host of ChallengesThe construction industry is under pressure from interconnected risks and notable macroeconomic developments. Learn how your organization can benefit from construction insurance and risk management.

Article 8 mins
How North American Construction Contractors Can Mitigate Emerging Risks
Article 7 mins
Managing Construction Risks: 7 Risk Advisory Steps
Article 7 mins
Unlocking Capacity and Capital in a Challenging Construction Risk Market
Article 7 mins
Protecting North American Contractors from Extreme Heat Risks with Parametric
Article 5 mins
How Climate Modeling Can Mitigate Risks and Improve Resilience in the Construction Industry
Report 1 mins
Construction Risk Management Europe Report 2023
Article 8 mins
Parametric Can Help Mitigate Extreme Heat Risks for Contractors in EMEA
Article 9 mins
How the Construction Industry is Navigating Climate Change
Article 11 mins
Top Risks Facing Construction and Real Estate OrganizationsStay in the loop on today's most pressing cyber security matters.

Cyber Labs 5 mins
Securely Adopting Digital Assets and Web3
Cyber Labs 8 mins
Bring Your Own Installer: Bypassing EDR Through Agent Version Change Interruption
Cyber Labs 17 mins
Maximizing value: How companies and pentesters can achieve more together
Cyber Labs 7 mins
DNSForge – Relaying with Force
Cyber Labs 14 mins
We’re All in This Together: The Case for Purple Teaming
Cyber Labs 7 mins
Parsing ESXi Logs for Incident Response with QELP
Cyber Labs 5 mins
Parsing Jenkins Configuration Files for Forensics and Fun
Cyber Labs 10 mins
Emerging Risks in Third-Party AI Solutions and How to Help Address Them
Cyber Labs 20 mins
Unveiling the Dark Side: Common Attacks and Vulnerabilities in Industrial Control Systems
Cyber Labs 9 mins
Mounted Guest EDR Bypass
Cyber Labs 6 mins
Optimizing Your Cyber Resilience Strategy Through CISO and CRO Connectivity
Cyber Labs 9 mins
Bypassing EDR through Retrosigned Drivers and System Time Manipulation
Cyber Labs 10 mins
DNSForge – Responding with Force
Cyber Labs 7 mins
Unveiling "sedexp": A Stealthy Linux Malware Exploiting udev Rules
Cyber Labs 3 mins
Command Injection and Path Traversal in StoneFly Storage Concentrator
Cyber Labs 7 mins
Adopt an AI Approach with Confidence, for CISOs and CIOs
Cyber Labs 3 mins
Responding to the CrowdStrike Outage: Implications for Cyber and Technology Professionals
Cyber Labs 10 mins
DUALITY Part II - Initial Access and Tradecraft Improvements
Cyber Labs 17 mins
Cracking Into Password Requirements
Cyber Labs 57 mins
DUALITY: Advanced Red Team Persistence through Self-Reinfecting DLL Backdoors for Unyielding ControlOur Cyber Resilience collection gives you access to Aon’s latest insights on the evolving landscape of cyber threats and risk mitigation measures. Reach out to our experts to discuss how to make the right decisions to strengthen your organization’s cyber resilience.

Article 8 mins
Cyber and E&O Market Conditions Remain Favorable Amid Emerging Global Risks
Article 7 mins
How to Navigate AI-Driven Cyber Risks
Article 9 mins
Building Resilience in a Buyer-Friendly Cyber and E&O Market
Article 11 mins
A Middle Market Roadmap for Cyber Resilience
Article 7 mins
Lessons Learned from the CrowdStrike Outage: 5 Strategies to Build Cyber Resilience
Article 8 mins
Responding to Cyber Attacks: How Directors and Officers and Cyber Policies Differ
Article 7 mins
Why Now is the Right Time to Customize Cyber and E&O Contracts
Article 6 mins
8 Steps Toward Building Better Resilience Against Rising Ransomware Attacks
Article 7 mins
Mitigating Insider Threats: Managing Cyber Perils While Traveling Globally
Article 4 mins
Managing Cyber Risk through Return on Security Investment
Article 10 mins
Mitigating Insider Threats: Your Worst Cyber Threats Could be Coming from Inside
Article 9 mins
Why HR Leaders Must Help Drive Cyber Security Agenda
Article 10 mins
Escalating Cyber Security Risks Mean Businesses Need to Build ResilienceOur Employee Wellbeing collection gives you access to the latest insights from Aon's human capital team. You can also reach out to the team at any time for assistance with your employee wellbeing needs.

Article 8 mins
Employer Strategies for Cancer Prevention and Treatment
Article 6 mins
The Long-Term Care Conundrum in the United States
Article 9 mins
Developing a Paid Leave Strategy That Supports Workers and Their Families
Article 9 mins
4 Ways to Foster a Thriving Workforce Amid Rising Health Costs
Article 9 mins
The Next Evolution of Wellbeing is About Performance
Article 6 mins
Three Ways Collective Retirement Plans Support HR Priorities
Article 9 mins
How the Right Employee Wellbeing Strategy Impacts Microstress and Burnout at Work
Podcast 13 mins
On Aon Podcast: The Future of Healthcare: Key Factors Impacting Medical Trend Rates
Article 7 mins
Making Wellbeing Part of a Company’s DNA
Article 7 mins
A Comprehensive Approach to Financial WellbeingExplore Aon's latest environmental social and governance (ESG) insights.
Podcast 16 mins
On Aon Podcast: Approach to DE&I in the WorkplaceOur Global Insurance Market Insights highlight insurance market trends across pricing, capacity, underwriting, limits, deductibles and coverages.

Article 12 mins
Q4 2023: Global Insurance Market Overview
Article 13 mins
Top Risk Trends to Watch in 2024How do the top risks on business leaders’ minds differ by region and how can these risks be mitigated? Explore the regional results to learn more.

Article 12 mins
Top Risks Facing Organizations in Asia Pacific
Article 12 mins
Top Risks Facing Organizations in North America
Article 10 mins
Top Risks Facing Organizations in Europe
Article 8 mins
Top Risks Facing Organizations in Latin America
Article 8 mins
Top Risks Facing Organizations in the Middle East and Africa
Article 9 mins
Top Risks Facing Organizations in the United KingdomOur Human Capital Analytics collection gives you access to the latest insights from Aon's human capital team. Contact us to learn how Aon’s analytics capabilities helps organizations make better workforce decisions.

Article 35 mins
5 Human Resources Trends to Watch in 2025
Article 13 mins
Medical Rate Trends and Mitigation Strategies Across the Globe
Article 9 mins
3 Strategies to Help Avoid Workers Compensation Claims Litigation
Podcast 15 mins
On Aon Podcast: Using Data and Analytics to Improve Health Outcomes
Article 14 mins
How Technology Will Transform Employee Benefits in the Next Five Years
Podcast 18 mins
On Aon Podcast: Technology Impacting the Future of Health and Benefits
Article 8 mins
Integrating Workforce Data to Uncover Hidden Insights
Podcast 24 mins
On Aon’s Better Being Series: Measuring Wellbeing
Article 11 mins
Designing Tomorrow: Personalizing EVP, Benefits and Total RewardsRead our collection of human capital articles that explore in depth hot topics for HR and risk professionals, including using data and analytics to measure total rewards programs, how HR and finance can better partner and the impact AI will have on the workforce.

Article 12 mins
Total Rewards Strategies That Drive Business Outcomes
Article 35 mins
5 Human Resources Trends to Watch in 2025
Article 20 mins
5 Ways HR Can Partner with Finance to Drive Growth
Article 15 mins
How Artificial Intelligence is Transforming Human Resources and the Workforce
Article 17 mins
Five Big Human Resources Trends to Watch in 2024
Article 11 mins
Designing Tomorrow: Personalizing EVP, Benefits and Total Rewards
Article 10 mins
How Data and Analytics Can Optimize HR Programs
Article 11 mins
Get Ready for the Top 5 HR Trends in 2023Explore our hand-picked insights for human resources professionals.

Article 7 mins
COVID-19 has Permanently Changed the Way We Think About Wellbeing
Article 7 mins
DE&I in Benefits Plans: A Global Perspective
Article 10 mins
How Data and Analytics Can Optimize HR Programs
Article 9 mins
Why HR Leaders Must Help Drive Cyber Security Agenda
Article 7 mins
Case Study: The LPGA Unlocks Talent Potential with Data
Article 10 mins
Navigating the New EU Directive on Pay Transparency
Article 4 mins
How to Design Better Talent Assessment to Promote DE&I
Article 6 mins
Training and Transforming Managers for the Future of Work
Article 7 mins
Rethinking Your Total Rewards Programs During Mergers and Acquisitions
Article 14 mins
Building a Resilient Workforce That Steers Organizational Success | An Outlook Across IndustriesOur Workforce Collection provides access to the latest insights from Aon’s Human Capital team on topics ranging from health and benefits, retirement and talent practices. You can reach out to our team at any time to learn how we can help address emerging workforce challenges.
Article 8 mins
Weather and Workforce: Employers Must Quantify the Risk
Article 12 mins
Total Rewards Strategies That Drive Business Outcomes
Article 19 mins
3 Strategies to Promote an Inclusive Environment and Bridge the Gender Gap
Article 8 mins
2025 Salary Increase Planning Tips
Article 8 mins
Employer Strategies for Cancer Prevention and Treatment
Article 6 mins
Taking a Data-Led Approach to Job Architecture to Accelerate Pay Transparency
Podcast 12 mins
Better Being Series: Building Sustainable Performance in a Multi-Generational Workforce
Article 7 mins
Key Trends in U.S. Benefits for 2025 and Beyond
Article 8 mins
Pay Transparency Can Lead to Better Equity Across Benefits
Article 17 mins
3 Strategies to Improve Career Outcomes for Older Employees
Article 9 mins
Developing a Paid Leave Strategy That Supports Workers and Their Families
Article 9 mins
4 Ways to Foster a Thriving Workforce Amid Rising Health CostsOur Mergers and Acquisitions (M&A) collection gives you access to the latest insights from Aon's thought leaders to help dealmakers make better decisions. Explore our latest insights and reach out to the team at any time for assistance with transaction challenges and opportunities.

Article 8 mins
Exit Strategy Value Creation Opportunities Exist as Economic Pressures Persist
Article 5 mins
Future Trends for Financial Sponsors: Secondary Transactions
Article 8 mins
3 Ways to Unlock M&A Value in a Challenging Credit Environment
Article 7 mins
Rethinking Your Total Rewards Programs During Mergers and Acquisitions
Article 9 mins
Organizational Design and Talent Planning are Key to M&A Success
Article 7 mins
An Ever-Complex Global Tax Environment Requires Strong M&A Risk Solutions
Article 5 mins
Project Management for HR: The Secret Behind a Successful M&A Deal
Article 9 mins
Cultural Alignment Planning Drives M&A Success
Report 1 mins
A Guide to Maximizing Value in Post-Merger Integrations
Report 2 mins
The ABC's of Private Equity M&A: Deal Flow Impacts of Al, Big Tech and Climate Change
Article 11 mins
The Silver Lining on M&A Deal Clouds: M&A Insurance Insights from 2023The challenges in adopting renewable energy are changing with technological advancements, increasing market competition and numerous financial support mechanisms. Learn how your organization can benefit from our renewables solutions.

Article 4 mins
5 Steps for Successful Carbon Accounting Verification
Article 6 mins
AI Innovations in Renewable Energy: Transforming the Sector
Article 11 mins
Securing Human Capital in Natural Resources
Article 6 mins
Decarbonizing Construction for a Low-Emission FutureHow do businesses navigate their way through new forms of volatility and make decisions that protect and grow their organizations?
Our Parametric Insurance Collection provides ways your organization can benefit from this simple, straightforward and fast-paying risk transfer solution. Reach out to learn how we can help you make better decisions to manage your catastrophe exposures and near-term volatility.

Article 10 mins
How Public Entities and Businesses Can Use Parametric for Emergency Funding
Article 6 mins
Parametric Insurance: A Complement to Traditional Property Coverage
Article 8 mins
Using Parametric Insurance to Match Capital to Climate Risk
Article 6 mins
Using Parametric Insurance to Close the Earthquake Protection Gap
Article 5 mins
How Technology Enhancements are Boosting ParametricOur Pay Transparency and Equity collection gives you access to the latest insights from Aon's human capital team on topics ranging from pay equity to diversity, equity and inclusion. Contact us to learn how we can help your organization address these issues.
Article 6 mins
Taking a Data-Led Approach to Job Architecture to Accelerate Pay Transparency
Article 19 mins
3 Strategies to Promote an Inclusive Environment and Bridge the Gender Gap
Report 1 mins
The 2024 North America Pay Transparency Readiness Study
Article 10 mins
How Financial Institutions can Prepare for Pay Transparency Legislation
Article 8 mins
Pay Transparency Can Lead to Better Equity Across Benefits
Article 12 mins
Understanding and Preparing for the Rise in Pay Transparency
Podcast 14 mins
On Aon Podcast: Understanding Pay Transparency Regulations
Article 10 mins
Navigating the New EU Directive on Pay Transparency
Article 7 mins
To Disclose Pay or Not? How Companies are Approaching the Pay Transparency Movement
Podcast 19 mins
On Aon Podcast: Better Being Series Dives into Women’s Health
Article 11 mins
Advancing Women’s Health and Equity Through Benefits and SupportForecasters are predicting an extremely active 2024 Atlantic hurricane season. Take measures to build resilience to mitigate risk for hurricane-prone properties.
Article 8 mins
Florida Hurricanes Not Expected to Adversely Affect Property Market
Article 10 mins
Build Resilience for an Extremely Active Atlantic Hurricane Season
Article 4 mins
Four Steps to Develop Strong Property Risk Coverage in a Hardening Market
Podcast 16 mins
On Aon Podcast: Navigating and Preparing for Catastrophes
Article 6 mins
Parametric Insurance: A Complement to Traditional Property Coverage
Article 4 mins
Navigating Climate Risk Using Multiple Models and Data Sets
Article 5 mins
Rising Losses From Severe Convection Storms Mostly Explained by Exposure Growth
Article 6 mins
Using Parametric Insurance to Close the Earthquake Protection GapOur Technology Collection provides access to the latest insights from Aon's thought leaders on navigating the evolving risks and opportunities of technology. Reach out to the team to learn how we can help you use technology to make better decisions for the future.
Article 9 mins
How AI and Workforce will Intersect: Navigating Risks and Opportunities
Article 23 mins
The AI Data Center Boom: Strategies for Sustainable Growth and Risk Management
Article 7 mins
How Technology is Transforming Open Enrollment in the U.S.
Article 15 mins
Navigating Cyber Risks in EMEA: Key Insights for 2025
Article 7 mins
How to Navigate AI-Driven Cyber Risks
Article 15 mins
How Artificial Intelligence is Transforming Human Resources and the Workforce
Alert 3 mins
Better Decisions Brief: Perspectives on the CrowdStrike Outage
Podcast 9 mins
On Aon Podcast: How has CrowdStrike Changed the Cyber Market?
Article 12 mins
5 Ways Artificial Intelligence can Boost Claims Management
Article 12 mins
Navigating AI-Related Risks: A Guide for Directors and Officers
Article 5 mins
How Technology Enhancements are Boosting Parametric
Article 9 mins
How to Futureproof Data and Analytics Capabilities for ReinsurersTrade, technology, weather and workforce stability are the central forces in today’s risk landscape.

Article 7 mins
Cyber Attack or Data Breach
Article 4 mins
Business Interruption
Article 4 mins
Economic Slowdown or Slow Recovery
Article 5 mins
Failure to Attract or Retain Top Talent
Article 5 mins
Regulatory or Legislative Changes
Article 4 mins
Supply Chain or Distribution Failure
Article 6 mins
Commodity Price Risk or Scarcity of Materials
Article 4 mins
Damage to Brand or Reputation
Article 5 mins
Failure to Innovate or Meet Customer Needs
Article 4 mins
Increasing Competition
Report 3 mins
Business Decision Maker SurveyOur Trade Collection gives you access to the latest insights from Aon's thought leaders on navigating the evolving risks and opportunities for international business. Reach out to our team to understand how to make better decisions around macro trends and why they matter to businesses.
Article 10 mins
Trade in a Technology-Driven Future
Podcast 9 mins
Special Edition: Global Trade and its Impact on Supply Chain
Article 8 mins
The Evolving Threat of Cargo Theft: 5 Key Mitigation Strategies
Report 3 mins
Global Risk Management Survey
Article 4 mins
Four Steps to Develop Strong Property Risk Coverage in a Hardening Market
Article 14 mins
Cutting Supply Chains: How to Achieve More Reward with Less Risk
Article 9 mins
Driving Private Equity Value Creation Through Credit Solutions
Article 7 mins
4 Steps to Help Take Advantage of a Buyer-Friendly Directors' & Officers' Market
Article 9 mins
Managing Reputational Risks in Global Supply Chains
Article 8 mins
How an Outsourced Chief Investment Officer Can Help Improve Governance and Manage Complexity
Article 8 mins
Decarbonizing Your Business: Finding the Right Insurance and Strategy
Article 8 mins
Reputation Analytics as a Leading Indicator of ESG RiskBetter Decisions Across Interconnected Risk and People Issues.

Report 5 mins
Chapter 1: Author’s Note & Executive Summary
Report 8 mins
Chapter 2: North America: Highlights, Claims Severity and Frequency
Report 3 mins
Chapter 3: North America: Breach Type and Notification
Report 24 mins
Chapter 4: North America: Industry Sectors and Trends
Report 4 mins
Chapter 5: North America: Tax Insurance Claims
Report 5 mins
Chapter 6: EMEA: Highlights and Introduction
Report 8 mins
Chapter 7: EMEA: Claim Frequency and Metrics
Report 7 mins
Chapter 8: EMEA: Notifications by Target Location and Claims Severity and Payment Trends
Report 9 mins
Chapter 9: EMEA: Breach Types and Trends
Report 7 mins
Chapter 10: EMEA: Case Law, Insurer Survey, Claims Handling and Tax
Report 5 mins
Chapter 11: APAC: Asia
Report 8 mins
Chapter 12: APAC: PacificWith a changing climate, organizations in all sectors will need to protect their people and physical assets, reduce their carbon footprint, and invest in new solutions to thrive. Our Weather Collection provides you with critical insights to be prepared.
Article 9 mins
Steering Trade and Supply Chains Amid Weather Challenges
Podcast 9 mins
On Aon Podcast: Climate Impact on the Property and Casualty Market
Alert 14 mins
L.A. Wildfires Highlight Urgent Need for Employee Support and Business Resilience
Report 2 mins
Climate and Catastrophe Insight
Article 10 mins
How Public Entities and Businesses Can Use Parametric for Emergency Funding
Podcast 12 mins
On Aon Podcast: Tackling Climate Risk to Build Economic Resilience
Article 8 mins
Understanding Freeze Risk in a Changing Climate
Podcast 9 mins
On Aon Podcast: Climate Science Through Academic Collaboration
Article 6 mins
How Companies Are Using Climate Modeling to Improve Risk Decisions
Article 8 mins
Using Parametric Insurance to Match Capital to Climate Risk
Article 9 mins
How the Construction Industry is Navigating Climate Change
Article 9 mins
Record Heatwaves: Protecting Employee Health and SafetyOur Workforce Resilience collection gives you access to the latest insights from Aon's Human Capital team. You can reach out to the team at any time for questions about how we can assess gaps and help build a more resilience workforce.
Article 4 mins
Using Data to Close Workforce Gaps in Financial Institutions
Article 5 mins
Using Data to Close Workforce Gaps in Retail Companies
Article 7 mins
Using Data to Close Workforce Gaps in Technology Companies
Article 4 mins
Using Data to Close Workforce Gaps in Manufacturing Companies
Article 6 mins
Using Data to Close Workforce Gaps in Life Sciences Companies
Report 4 mins
Measure Workforce Resilience for Better Business Outcomes
Podcast 18 mins
On Aon Podcast: Methodology to Predict Employee Performance for the LPGA
Article 6 mins
Training and Transforming Managers for the Future of Work
Article 14 mins
Building a Resilient Workforce That Steers Organizational Success | An Outlook Across IndustriesYou will soon receive an email to verify your email address. Please click on the link included in this note to complete the subscription process, which also includes providing consent in applicable locations and an opportunity to manage your email preferences.

Article
Article
Your request is being reviewed so we can align you to the best resources on our team. In the meantime, we invite you to explore some of our latest insights below.
Article
Article